Data Analysis Online: Unlock 100% Data-Driven Insights

CSVmaster offers intuitive, out-of-the-box support for multi-column filtering, sorting, grouping and aggregation, along with automatic creation of data visualizations.
Published At:
Last Updated:
The field of data analysis is very expansive and closely related with other disciplines such as analytics, mathematics, software development, and beyond. Since covering all topics is impossible, we'll focus on the root elements shared across all data analysis methods. With a good grasp of these building blocks, diving into deeper data analysis subjects becomes much easier and intuitive.
Data Organization: The Key Factor for Effective Data Analysis
Picture data structure as the architect of information, transforming chaos into order. By arranging data in a manner that's both intuitive and logical, we ensure that accessing, understanding, and manipulating information becomes a seamless part of your digital adventure.
Before diving deeper into the subject, let's explore a fundamental building block of data organization:
-
CSV -
Picture this as a no-frills, efficient way to store tabular data, where each line is a row from your table, and the columns within those rows are neatly separated by a delimiter, often a comma. CSV files shine when it comes to compatibility and support across different data analysis and data analytics platforms, offering a streamlined and compact representation of information that results in lightweight, easy-to-share files.
However, the simplicity of CSV comes with its own set of challenges. Despite its widespread adoption in the realm of online data analysis, CSV files can be a bit of a puzzle to read or understand at a glance. Moreover, manually crafting or tweaking CSV files requires a careful balance of precision and patience.
To delve deeper into understanding CSV structure, common pitfalls, and further insights, click here. - JSON - In the software development sector, JSON (JavaScript Object Notation) is a popular format for storing and transferring structured data between web servers and applications. It uses a key-value pair structure, similar to CSV files, where "keys" act like column names and "values" as row data, streamlining data exchange. While JSON enhances readability and is well-suited for web contexts, it's important to note that JSON files can grow in size due to the repetition of column names for each value. This can make JSON less efficient for large data volumes, presenting a challenge in maintaining minimal data storage.
-
Excel -
In the realm of online data analysis, Microsoft Excel stands out with features for sorting, analyzing, and beautifying data. Its arsenal of mathematical formulas, dynamic charts, and sleek formatting options.
Yet, the very flexibility that makes Excel outstanding can also lead us into a labyrinth of complexity,
especially when we venture into the creation of intricate structures like nested tables.
Although creators may marvel at these complex tables, they pose significant challenges for external tools attempting to analyze them.
For those delving into data analytics with Excel, simplicity should be your compass. Opting for a clean CSV structure with neatly organized columns and rows is not just about adhering to a widely recognized format; it's about ensuring your data's journey from raw numbers to insightful analysis is as smooth and accessible as possible.
Online data analysis works best when it's kept simple; No matter the tool, organizing your data clearly and systematically is essential. A well-structured dataset eliminates confusion, eases sharing, and boosts processing efficiency. Avoid complex layers; they only make analysis and management harder. Keeping your dataset straightforward not only maintains its integrity but also maximizes its potential for insightful data analytics.
Data Sorting: 3 Key States of Rearrangement

In sorting context, information can be viewed as having 3 main states:
- Unsorted- This is the initial state where the information remains in its original form, without any specific order applied. The sequence may reflect the order in which information was entered or an arbitrary arrangement, indicating that no deliberate method has been utilized to organize it.
- Sorted in Descending Order - Analogous to how an airplane descends towards the ground, information arranged in descending order is organized from the highest value at the top to the lowest value at the bottom. This method allows for a top-down examination, starting with the largest, most significant, or latest items.
- Sorted in Descending Order - Similar to an airplane ascending from the ground into the sky, information sorted in ascending order is organized from the lowest value at the bottom to the highest value at the top. This arrangement facilitates a bottom-up approach, beginning with the smallest, least significant, or earliest items.
Diving into a vast ocean of data, such as a dataset with a million rows detailing your company's sales for example, might seem complex at first. Yet, by employing simple data analysis techniques like sorting, you can swiftly uncover valuable insights. Sorting this colossal dataset in descending order illuminates the stars of your sales force—the top performers—almost instantly. Flip the script, sorting in ascending order, and you spotlight the underperformers, providing a clear view of sales needing a boost. This strategic approach, whether you're spotlighting the top or bottom performers, is a cornerstone of effective online data analysis.
Applying sorting to dates significantly enhances data analysis. When you organize information by date-time values, you create a chronological timeline, offering a lens to view how trends evolve. This insight is invaluable for spotting seasonal patterns or understanding time-related metrics. Such a timeline perspective in online data analysis is key to uncovering deep insights, guiding informed decisions by tracking how data shifts over time.
Data Filtering: Narrow Down to Focus Only on What Matters

Filters typically accept an input of a certain type, such as a number, date, or string, and are easy to grasp. They process the input and yield one of two possible outcomes:
- Retain the current value.
- Exclude the current value.
For further simplification, imagine that a filter asks a simple question: "Should I keep this value?" The decision to retain or exclude the value, depends on whether it meets specific conditions.
Conditions are essentially the filter's rulebook, telling it how to make the big "keep or throw" decision. Imagine a number 3 entering the filter's domain. A simple condition rule might be: "Keep it if it's a positive number." Upon reviewing the number and finding it above zero, the filter concludes, "Okay, it meets the criteria. It's accepted.
Multiple conditions can be combined into more complex logical constructs known as statements, primarily using two operators: "AND" and "OR".
Simple example:
- Condition 1: The value must be a positive number.
- Condition 2: The value must be less than 2.
Using "OR" requires at least one condition to be satisfied. So, the number 3, being positive, meets the "OR" criteria despite being greater than 2.
Understanding how to effectively use "AND" and "OR" operators to combine conditions into complex logical statements is essential for creating powerful filters for analysis. These tools enable us to precisely define criteria for including or excluding values, thereby refining our data analysis, manipulation, or validation tasks.
Data Grouping: Instant Benefits for Data Analysis

Grouping operates on a clear and straightforward principle: each group is formed around a unique key. Imagine you're a superstore manager with numerous sales records from various countries. When you group by the "country" column, the process involves identifying each unique country value in the dataset and creating a distinct group for it. This group then includes all the sales records for that particular country. Once the information is grouped, investigating each country (or group) individually or comparing them becomes much simpler. For instance, you could effortlessly compare sales figures across different countries.
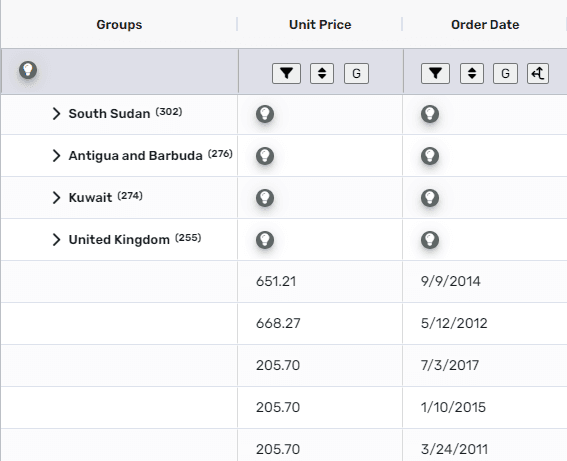
Grouping proves to be an incredibly useful tool for online data analysis as it organizes information into categories efficiently, offering significant flexibility when it comes to comparing these groups. This organizational method enhances your ability to analyze and understand data by segment, driving deeper insights and more strategic decisions.
Data Aggregation: The Best Path to Top-Notch Insights

Aggregation and Grouping: The Ultimate Formula for Uncovering Insights
Grouping followed by aggregation stands as the premier strategy for deriving data insights, offering a easy and quick approach to data analysis. This method simplifies comparison by reducing each group to a single, summarized value, eliminating the need to sift through every individual piece of information within the group. For instance, consider a retail chain analyzing sales across different regions. By grouping sales data by region and then aggregating it (For example calculating total or average sales for each region), decision-makers can easily compare performance across regions, identify trends, and make informed strategic decisions.
Aggregation and Grouping: The Foundation of Effective Visualization
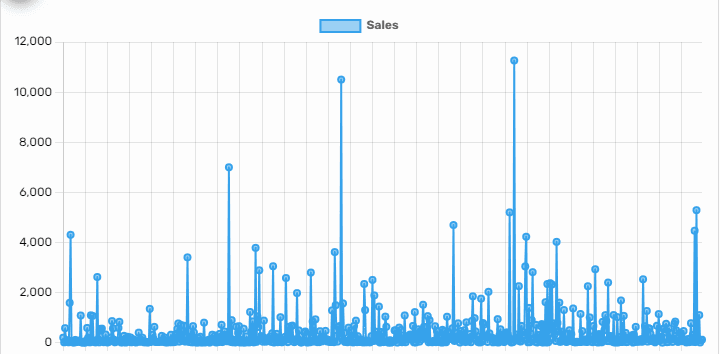
In the next section, we'll dive into visualization, but first, let's understand why aggregation is crucial before we can effectively visualize data. Imagine tracking your household expenses, accumulating a vast dataset over time. To bring this data to life, you employ a visualization tool. However, the initial excitement may quickly turn to a mess as you're greeted by a chaotic display:
 ,
,
Despite the graphical representation, the sheer volume of data points merges into what resembles a visual jumble, making it challenging to derive meaningful insights and just plain bad practice for data analysis. What's the remedy for such a conundrum? The key lies in organization and simplification.. By categorizing expenses into groups based on specific attributes, we initiate clarity. Following this, aggregating the data within these groups help reducing the complexity to a manageable level.
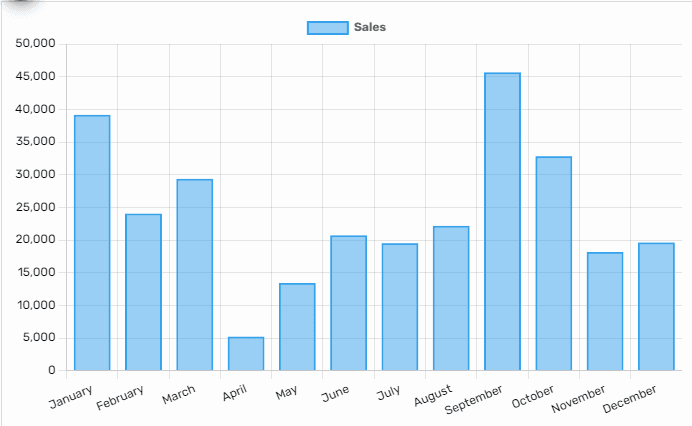
Taking the earlier example, if we group our data by a some category, like months, and then aggregate the information within each group (month) , we end up with a straightforward and useful visualization that is easy to grasp and examine:
Understanding the fundamentals of data organization, filtering, sorting, grouping, and aggregating expands your data analysis toolbox and elevates you to a professional-level data analyst.
- To start your online data analysis journey, click here.
- To explore example datasources for free, click here.
- To delve further into our home page, click here.